Raw Data
with open('prices.csv', 'r') as file:
    prices = file.read()

print(prices)
ABC,2017-09-05,163.09,164.24,160.21,162.63,29417590.0,162.49,29414672.0
ABC,2017-09-06,162.85,162.46,159.99,161.13,21131267.0,162.44,21169319.0
ABC,2017-09-07,162.11,162.7,160.65,161.26,21722502.0,161.46,21719856.0
ABC,2017-09-08,160.41,160.89,159.31,158.05,28311012.0,158.26,28305810.0
ABC,2017-09-11,161.09,162.14,159.54,161.29,31075573.0,160.97,31163734.0
ABC,2017-09-12,162.54,164.61,159.52,161.09,70921229.0,160.62,71097150.0
ABC,2017-09-13,160.01,160.51,158.22,159.29,44580353.0,159.07,44260255.0
EFG,2017-09-05,154.45,154.69,153.17,154.52,1270203.0,153.58,1270679.0
EFG,2017-09-06,155.03,155.14,153.89,154.45,1195987.0,154.06,1196107.0
EFG,2017-09-07,154.73,155.36,153.6,155.68,1420730.0,155.6,1409098.0
EFG,2017-09-08,156.01,155.91,154.17,155.86,1438929.0,156.08,1445338.0
EFG,2017-09-11,157.07,157.71,155.93,157.17,1608840.0,156.7,1610357.0
EFG,2017-09-12,155.98,156.72,154.28,156.71,1692197.0,156.86,1687819.0
EFG,2017-09-13,156.4,157.07,155.68,155.54,1211779.0,155.85,1210716.0
XYZ,2017-09-05,63.9,64.51,63.13,63.95,1738651.0,63.33,1733249.0
XYZ,2017-09-06,63.85,63.65,61.72,62.23,3730110.0,61.95,3725435.0
XYZ,2017-09-07,61.97,61.93,59.47,60.46,6166046.0,60.64,6191712.0
XYZ,2017-09-08,60.36,60.45,58.51,59.35,5173590.0,59.4,5174940.0
XYZ,2017-09-11,60.04,59.92,57.68,58.24,5003322.0,58.02,5001118.0
XYZ,2017-09-12,58.19,59.29,57.89,58.71,3633446.0,58.96,3635132.0
XYZ,2017-09-13,59.01,60.66,58.8,60.33,3571591.0,60.46,3583560.0
The data provider will provide you with information for each field in the CSV. This csv has the fields ticker, date, open, high, low, close, volume, adj_close, adj_volume in that order. That means, the first line in the CSV has the following data:
- ticker: ABC
- date: 2017-09-05
- open: 163.09
- high: 164.24
- low: 160.21
- close: 162.63
- volume: 29417590.0
- adj_close: 162.49
- adj_volume: 29414672.0
Read_csv
price_df = pd.read_csv('prices.csv', names=['ticker', 'date', 'open', 'high', 'low',
                                             'close', 'volume', 'adj_close', 'adj_volume'])

price_df
| ticker | date | open | high | low | close | volume | adj_close | adj_volume | |
|---|---|---|---|---|---|---|---|---|---|
| 0 | ABC | 2017-09-05 | 163.09 | 164.24 | 160.21 | 162.63 | 29417590.0 | 162.49 | 29414672.0 |
| 1 | ABC | 2017-09-06 | 162.85 | 162.46 | 159.99 | 161.13 | 21131267.0 | 162.44 | 21169319.0 |
| 2 | ABC | 2017-09-07 | 162.11 | 162.70 | 160.65 | 161.26 | 21722502.0 | 161.46 | 21719856.0 |
| 3 | ABC | 2017-09-08 | 160.41 | 160.89 | 159.31 | 158.05 | 28311012.0 | 158.26 | 28305810.0 |
| 4 | ABC | 2017-09-11 | 161.09 | 162.14 | 159.54 | 161.29 | 31075573.0 | 160.97 | 31163734.0 |
| 5 | ABC | 2017-09-12 | 162.54 | 164.61 | 159.52 | 161.09 | 70921229.0 | 160.62 | 71097150.0 |
| 6 | ABC | 2017-09-13 | 160.01 | 160.51 | 158.22 | 159.29 | 44580353.0 | 159.07 | 44260255.0 |
| 7 | EFG | 2017-09-05 | 154.45 | 154.69 | 153.17 | 154.52 | 1270203.0 | 153.58 | 1270679.0 |
| 8 | EFG | 2017-09-06 | 155.03 | 155.14 | 153.89 | 154.45 | 1195987.0 | 154.06 | 1196107.0 |
| 9 | EFG | 2017-09-07 | 154.73 | 155.36 | 153.60 | 155.68 | 1420730.0 | 155.60 | 1409098.0 |
| 10 | EFG | 2017-09-08 | 156.01 | 155.91 | 154.17 | 155.86 | 1438929.0 | 156.08 | 1445338.0 |
| 11 | EFG | 2017-09-11 | 157.07 | 157.71 | 155.93 | 157.17 | 1608840.0 | 156.70 | 1610357.0 |
| 12 | EFG | 2017-09-12 | 155.98 | 156.72 | 154.28 | 156.71 | 1692197.0 | 156.86 | 1687819.0 |
| 13 | EFG | 2017-09-13 | 156.40 | 157.07 | 155.68 | 155.54 | 1211779.0 | 155.85 | 1210716.0 |
| 14 | XYZ | 2017-09-05 | 63.90 | 64.51 | 63.13 | 63.95 | 1738651.0 | 63.33 | 1733249.0 |
| 15 | XYZ | 2017-09-06 | 63.85 | 63.65 | 61.72 | 62.23 | 3730110.0 | 61.95 | 3725435.0 |
| 16 | XYZ | 2017-09-07 | 61.97 | 61.93 | 59.47 | 60.46 | 6166046.0 | 60.64 | 6191712.0 |
| 17 | XYZ | 2017-09-08 | 60.36 | 60.45 | 58.51 | 59.35 | 5173590.0 | 59.40 | 5174940.0 |
| 18 | XYZ | 2017-09-11 | 60.04 | 59.92 | 57.68 | 58.24 | 5003322.0 | 58.02 | 5001118.0 |
| 19 | XYZ | 2017-09-12 | 58.19 | 59.29 | 57.89 | 58.71 | 3633446.0 | 58.96 | 3635132.0 |
| 20 | XYZ | 2017-09-13 | 59.01 | 60.66 | 58.80 | 60.33 | 3571591.0 | 60.46 | 3583560.0 |
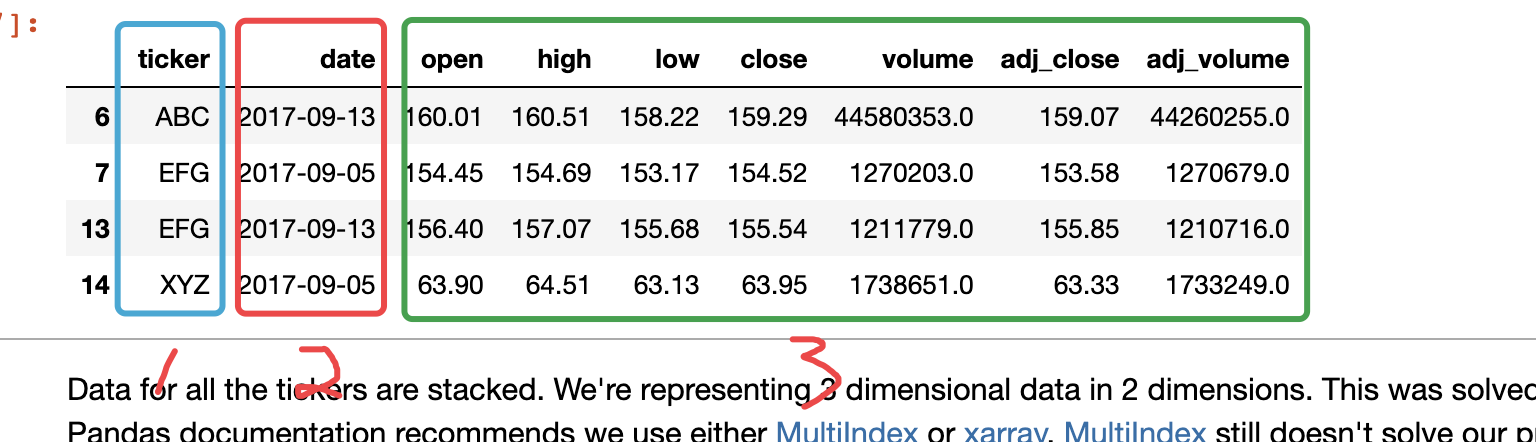
Problem Founded
Data for all the tickers are stacked. We’re representing 3 dimensional data in 2 dimensions.
Solve: DataFrame.pivot
We can split each 3rd dimension into it’s own 2 dimension DataFrame. In our case, our third dimensions are “open”, “high”, “low”, “close”, “volume”, “adj_close”, and “adj_volume”. We’ll use the DataFrame.pivot function to generate these DataFrames.
open_prices = price_df.pivot(index='date', columns='ticker', values='open')
| ticker | ABC | EFG | XYZ |
|---|---|---|---|
| date | |||
| 2017-09-05 | 163.09 | 154.45 | 63.90 |
| 2017-09-06 | 162.85 | 155.03 | 63.85 |
| 2017-09-07 | 162.11 | 154.73 | 61.97 |
| 2017-09-08 | 160.41 | 156.01 | 60.36 |
| 2017-09-11 | 161.09 | 157.07 | 60.04 |
| 2017-09-12 | 162.54 | 155.98 | 58.19 |
| 2017-09-13 | 160.01 | 156.40 | 59.01 |