In this blog, I will code and evaluate a “breakout” signal, and take this as an example to demonstrate the process of Alpha Reserch.
Alpha Research Process
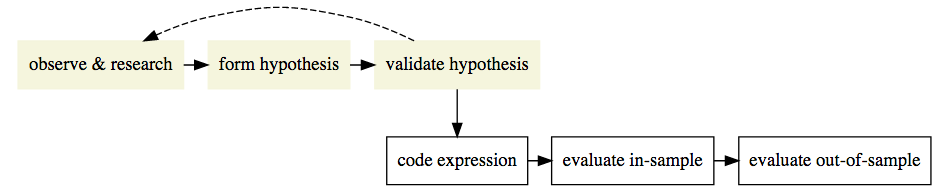
It is important to understand where these steps fit in the alpha research workflow. The signal-to-noise ratio in trading signals is very low and, as such, it is very easy to fall into the trap of overfitting to noise. It is therefore inadvisable to jump right into signal coding. To help mitigate overfitting, it is best to start with a general observation and hypothesis.
Always ask yourself if you’re able to answer the following question before you touch any data:
What feature of markets or investor behaviour would lead to a persistent anomaly that my signal will try to use?
Ideally the assumptions behind the hypothesis will be testable before you actually code and evaluate the signal itself. The workflow therefore is as follows:
Breakout Strategy
Hypothesis
After the first three steps area done (“observe & research”, “form hypothesis”, “validate hypothesis”), the hypothesis using for this project is the following:
- In the absence of news or significant investor trading interest, stocks oscillate in a range.
- Traders seek to capitalize on this range-bound behaviour periodically by selling/shorting at the top of the range and buying/covering at the bottom of the range. This behaviour reinforces the existence of the range.
- When stocks break out of the range, due to, e.g., a significant news release or from market pressure from a large investor:
- the liquidity traders who have been providing liquidity at the bounds of the range seek to cover their positions to mitigate losses, thus magnifying the move out of the range, and
- the move out of the range attracts other investor interest; these investors, due to the behavioural bias of herding (e.g., Herd Behavior) build positions which favor continuation of the trend.
Compute Max/min price in a window
Use the price highs and lows as an indicator for the breakout strategy.
In this section, implement get_high_lows_lookback to get the maximum high price and minimum low price over a window of days. The variable lookback_days contains the number of days to look in the past. Make sure this doesn’t include the current day.
def get_high_lows_lookback(high, low, lookback_days):
    """
    Get the highs and lows in a lookback window.

    Parameters
    ----------
    high : DataFrame
        High price for each ticker and date
    low : DataFrame
        Low price for each ticker and date
    lookback_days : int
        The number of days to look back

    Returns
    -------
    lookback_high : DataFrame
        Lookback high price for each ticker and date
    lookback_low : DataFrame
        Lookback low price for each ticker and date
    """

    lookback_high = high.shift(1).rolling(window = lookback_days).max()
    lookback_low = low.shift(1).rolling(window = lookback_days).min()

    return lookback_high, lookback_low
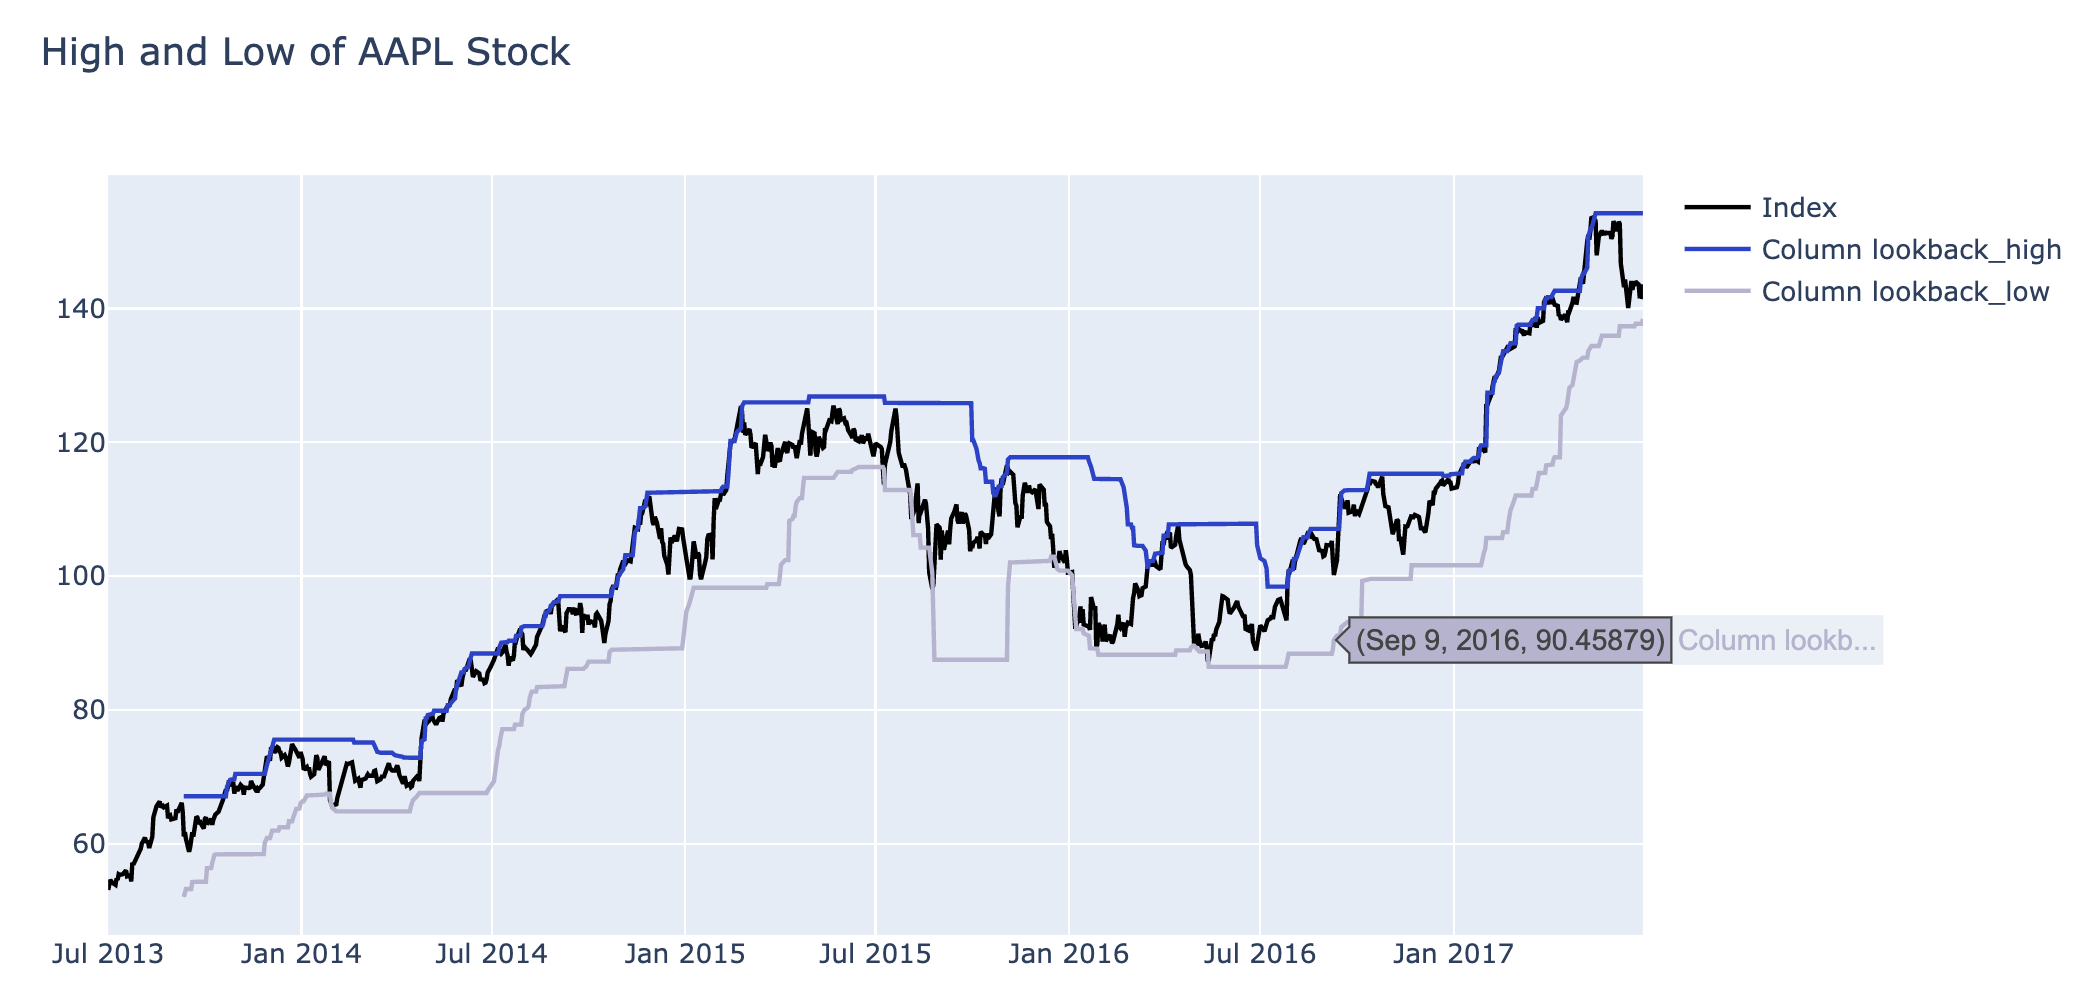
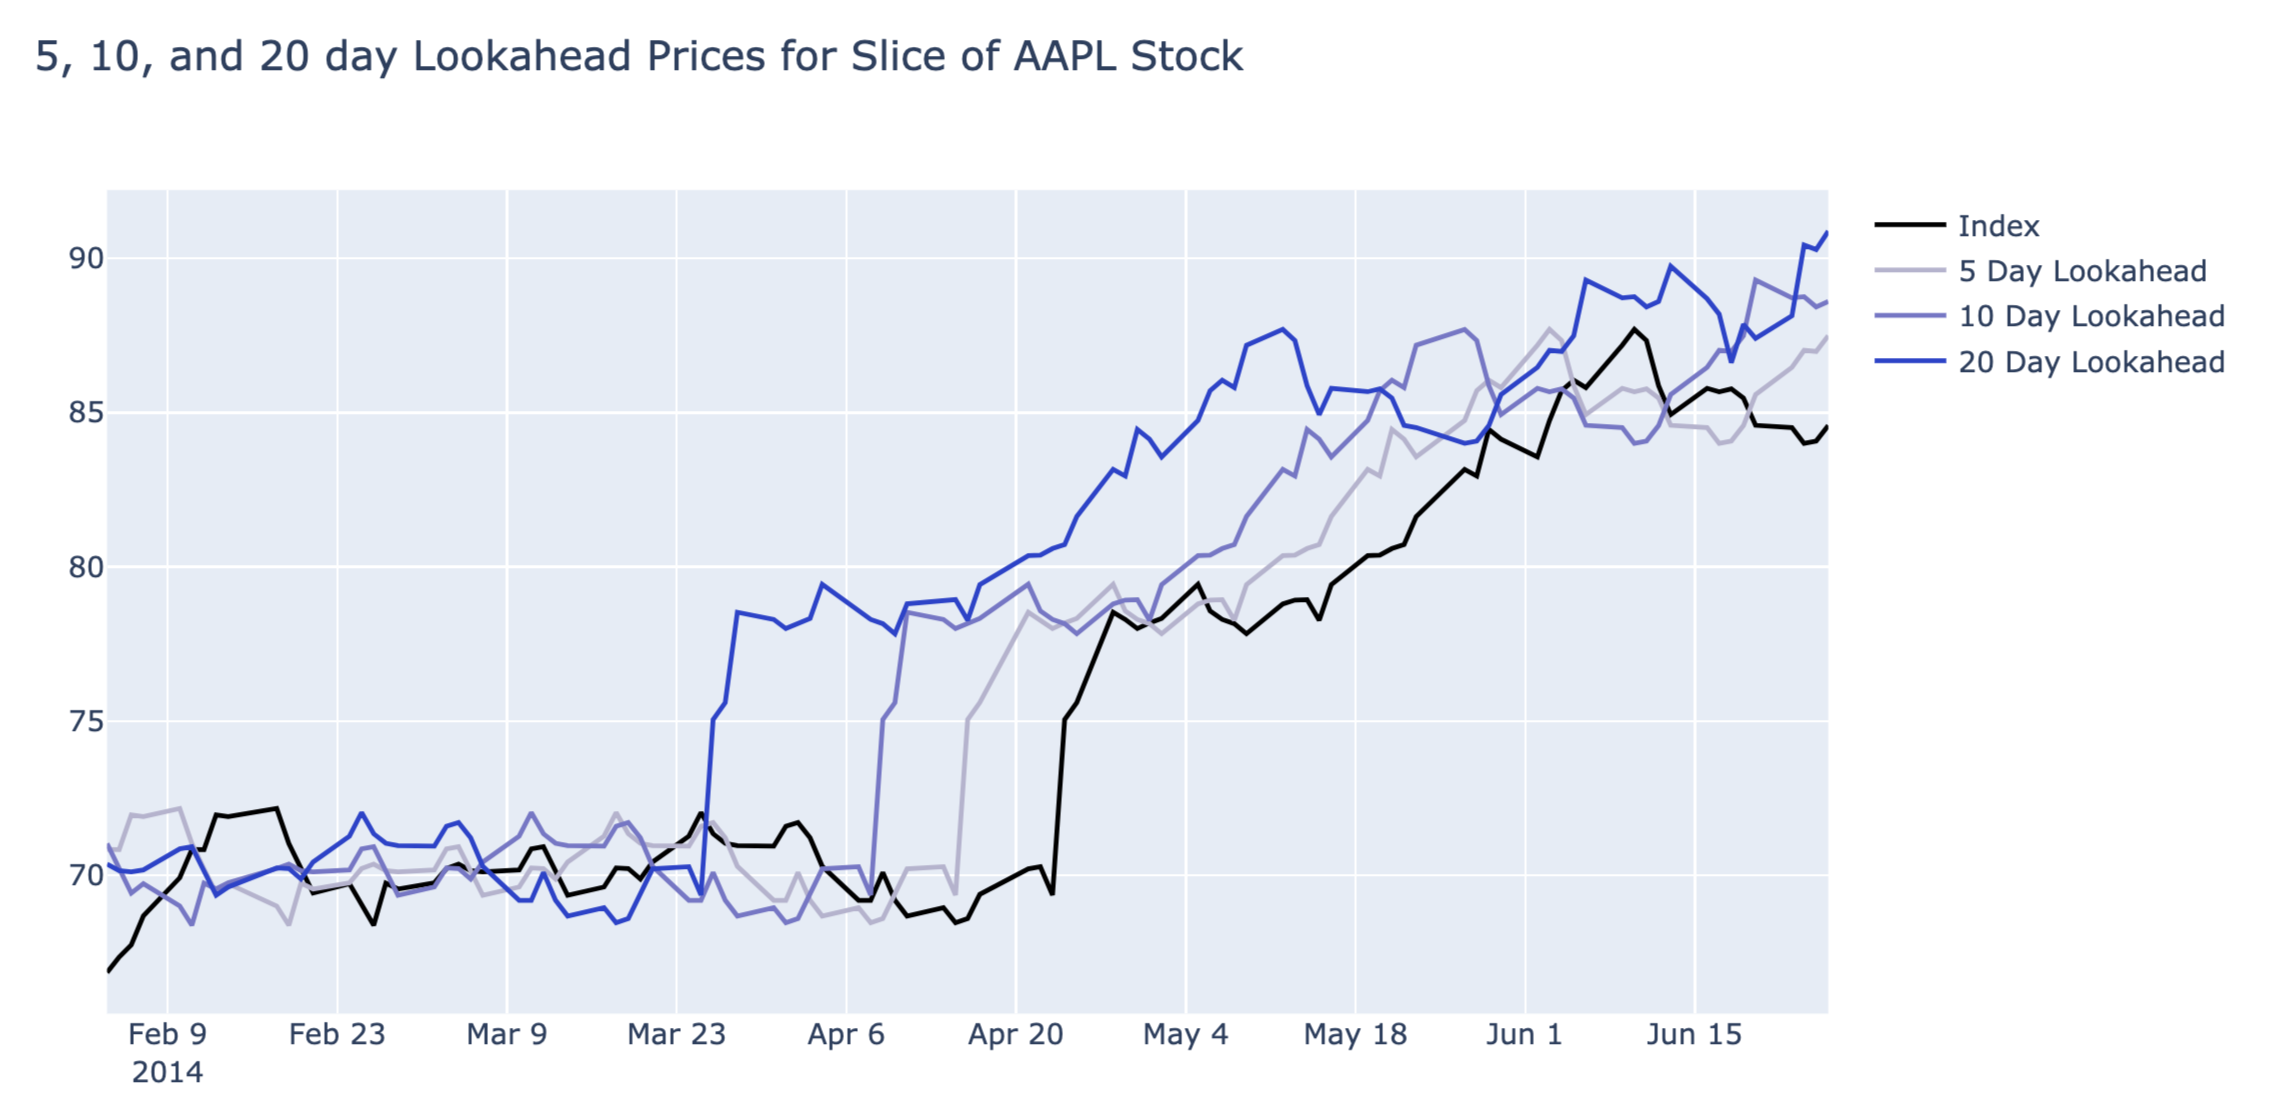
Lookback for 50 days, and the highs and lows lines are as follow.
Generate Signal
Using the generated indicator of highs and lows, create long and short signals using a breakout strategy.
| Signal | Condition |
|---|---|
| -1 | Low > Close Price |
| 1 | High < Close Price |
| 0 | Otherwise |
In this chart, Close Price is the close parameter. Low and High are the values generated from get_high_lows_lookback, the lookback_high and lookback_low parameters.
def get_long_short(close, lookback_high, lookback_low):
    """
    Generate the signals long, short, and do nothing.

    Parameters
    ----------
    close : DataFrame
        Close price for each ticker and date
    lookback_high : DataFrame
        Lookback high price for each ticker and date
    lookback_low : DataFrame
        Lookback low price for each ticker and date

    Returns
    -------
    long_short : DataFrame
        The long, short, and do nothing signals for each ticker and date
    """

    return ((close > lookback_high).astype(np.int)) - ((close < lookback_low).astype(np.int))
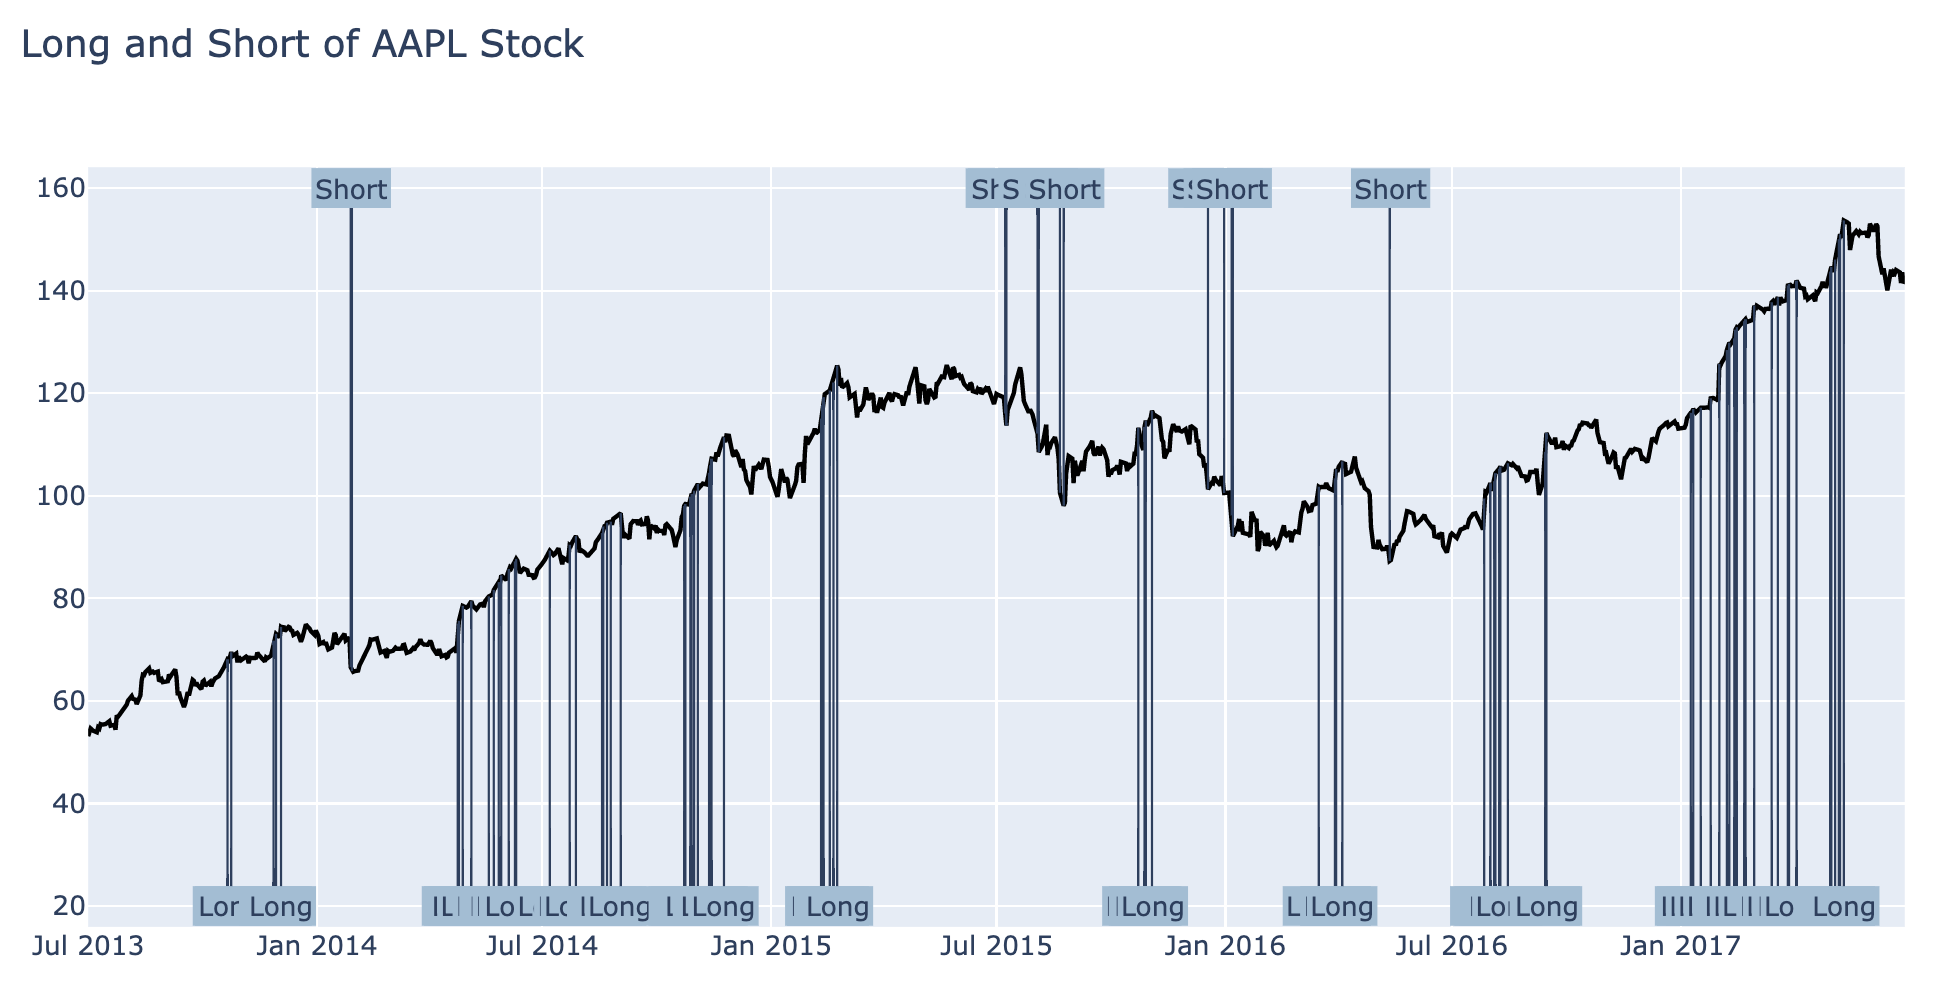
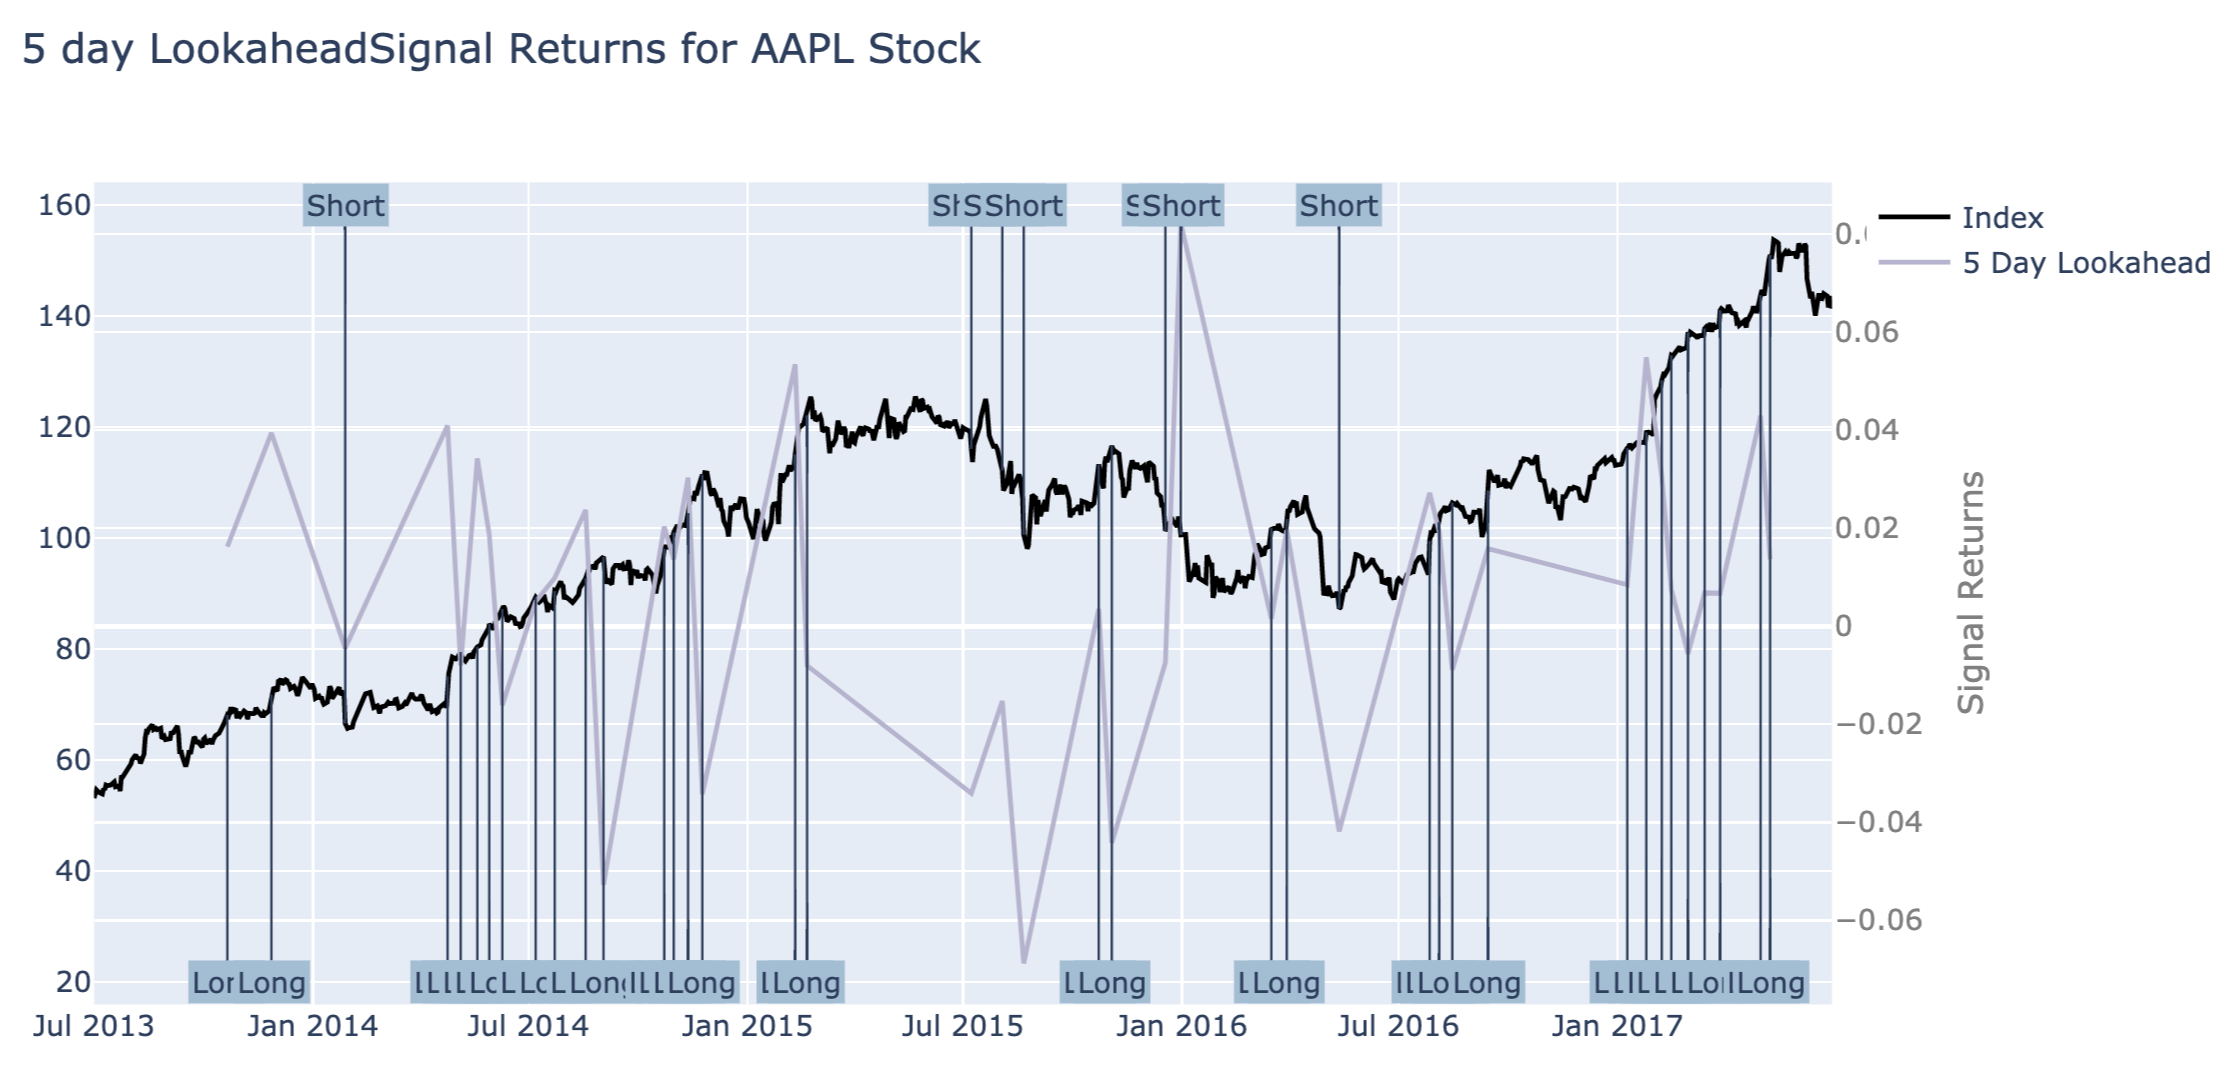
Generated signals are follows.
Filter Signals
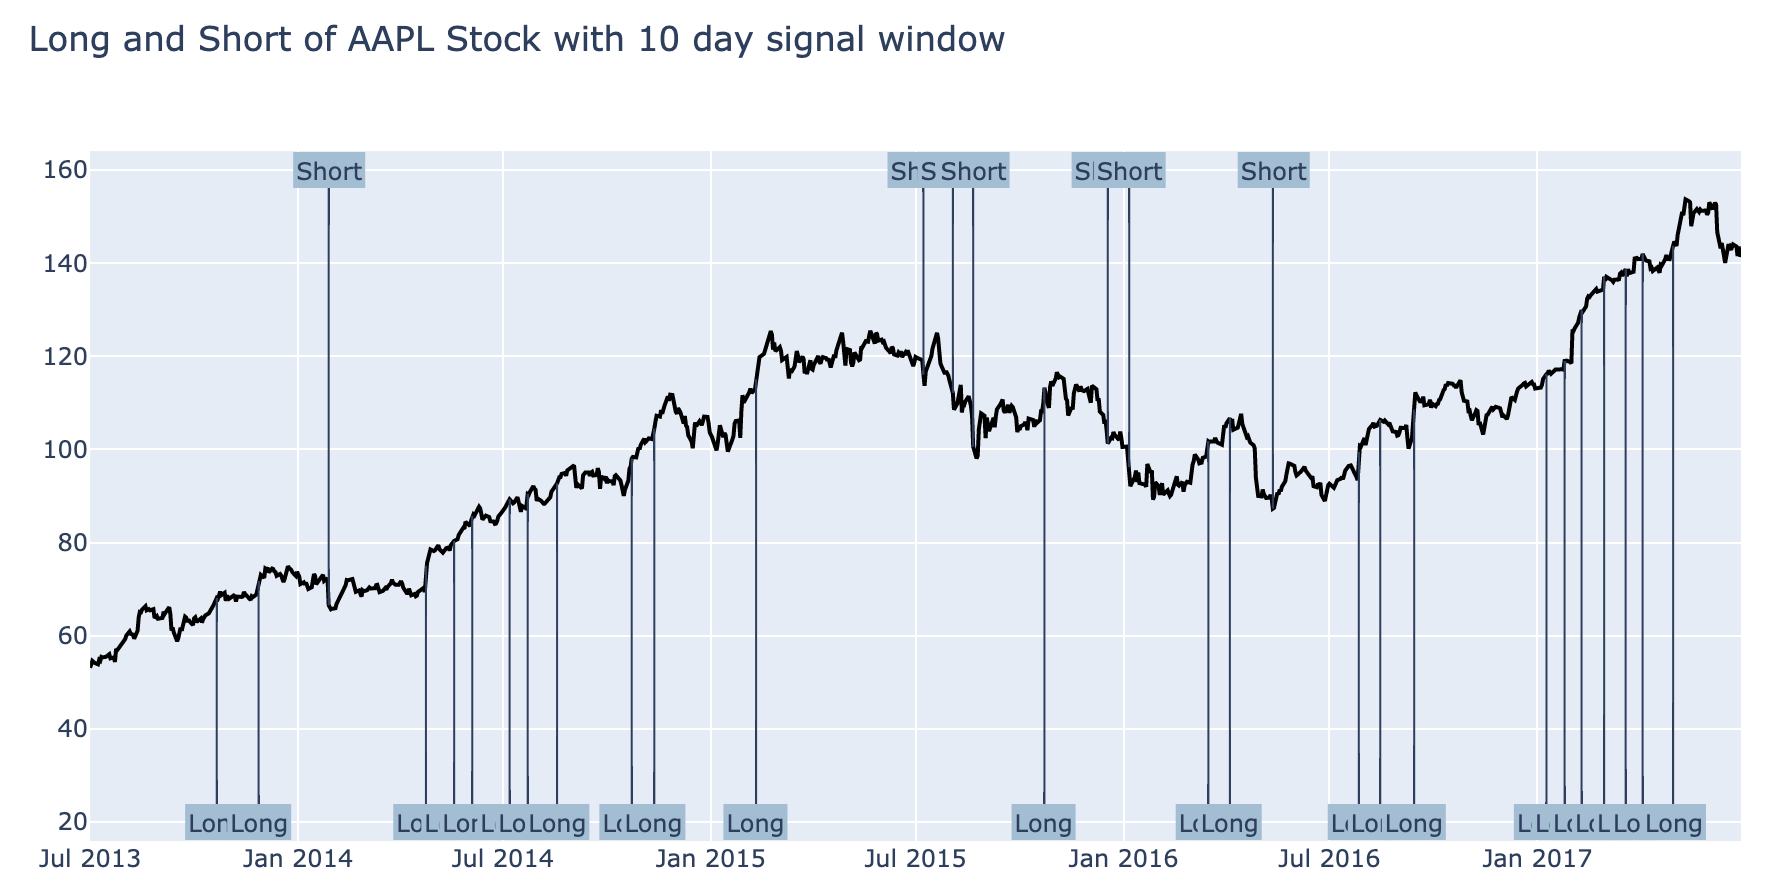
That was a lot of repeated signals! If we’re already shorting a stock, having an additional signal to short a stock isn’t helpful for this strategy. This also applies to additional long signals when the last signal was long.
Implement filter_signals to filter out repeated long or short signals within the lookahead_days. If the previous signal was the same, change the signal to 0 (do nothing signal). For example, say you have a single stock time series that is
[1, 0, 1, 0, 1, 0, -1, -1]
Running filter_signals with a lookahead of 3 days should turn those signals into
[1, 0, 0, 0, 1, 0, -1, 0]
To help implement the function, we need to create the clear_signals function. This will remove all signals within a window after the last signal. For example, say you’re using a windows size of 3 with clear_signals. It would turn the Series of long signals
[0, 1, 0, 0, 1, 1, 0, 1, 0]
into
[0, 1, 0, 0, 0, 1, 0, 0, 0]
clear_signals only takes a Series of the same type of signals, where 1 is the signal and 0 is no signal. It can’t take a mix of long and short signals.
def clear_signals(signals, window_size):
    """
    Clear out signals in a Series of just long or short signals.

    Remove the number of signals down to 1 within the window size time period.

    Parameters
    ----------
    signals : Pandas Series
        The long, short, or do nothing signals
    window_size : int
        The number of days to have a single signal

    Returns
    -------
    signals : Pandas Series
        Signals with the signals removed from the window size
    """
    # Start with buffer of window size
    # This handles the edge case of calculating past_signal in the beginning
    clean_signals = [0]*window_size

    for signal_i, current_signal in enumerate(signals):
        # Check if there was a signal in the past window_size of days
        has_past_signal = bool(sum(clean_signals[signal_i:signal_i+window_size]))
        # Use the current signal if there's no past signal, else 0/False
        clean_signals.append(not has_past_signal and current_signal)

    # Remove buffer
    clean_signals = clean_signals[window_size:]

    # Return the signals as a Series of Ints
    return pd.Series(np.array(clean_signals).astype(np.int), signals.index)


def filter_signals(signal, lookahead_days):
    """
    Filter out signals in a DataFrame.

    Parameters
    ----------
    signal : DataFrame
        The long, short, and do nothing signals for each ticker and date
    lookahead_days : int
        The number of days to look ahead

    Returns
    -------
    filtered_signal : DataFrame
        The filtered long, short, and do nothing signals for each ticker and date
    """
    #TODO: Implement function

    #Make a copy of the signal dataframe using copy()
    filtered_signal = signal.copy()

    #Iterate over the transposed signal using iterrows as follows:
    for ticker, ticker_signals in signal.T.iterrows():
        long_signals = signal[ticker].copy()
        long_signals = long_signals.replace(-1,0)

        short_signals = signal[ticker].copy()
        short_signals = short_signals.replace(1,0)
        filtered_signal[ticker] = clear_signals(long_signals, lookahead_days) + clear_signals(short_signals, lookahead_days)

        #make a copy of the ticker_Signals and store it as long_signals
        #query the long_signals and filter out rows where long_signals==-1 and assign them 0
        #make a copy of the ticker_Signals and store it as short_signals
        #query the short_signals and filter out rows where short_signals==1 and assign them 0

        # make use of clear_signals and pass long_signals & lookahead days as args to it
# + make use of clear_signals and pass short_signal and lookahead days as args to it
# and store the sum obtained in filtered_signal[ticker]

    return filtered_signal


Calculate Lookahead Return
With the trading signal done, we can start working on evaluating how many days to short or long the stocks.
Implement get_lookahead_prices to get the close price days ahead in time. Implement get_return_lookahead to generate the log price return between the closing price and the lookahead price.
def get_lookahead_prices(close, lookahead_days):
    return close.shift(-lookahead_days)


def get_return_lookahead(close, lookahead_prices):
    """
    Calculate the log returns from the lookahead days to the signal day.

    Parameters
    ----------
    close : DataFrame
        Close price for each ticker and date
    lookahead_prices : DataFrame
        The lookahead prices for each ticker and date

    Returns
    -------
    lookahead_returns : DataFrame
        The lookahead log returns for each ticker and date
    """
    return np.log(lookahead_prices) - np.log(close)

Calculate Signal Return
def get_signal_return(signal, lookahead_returns):
    """
    Compute the signal returns.

    Parameters
    ----------
    signal : DataFrame
        The long, short, and do nothing signals for each ticker and date
    lookahead_returns : DataFrame
        The lookahead log returns for each ticker and date

    Returns
    -------
    signal_return : DataFrame
        Signal returns for each ticker and date
    """
    return signal*lookahead_returns
Test for Significance
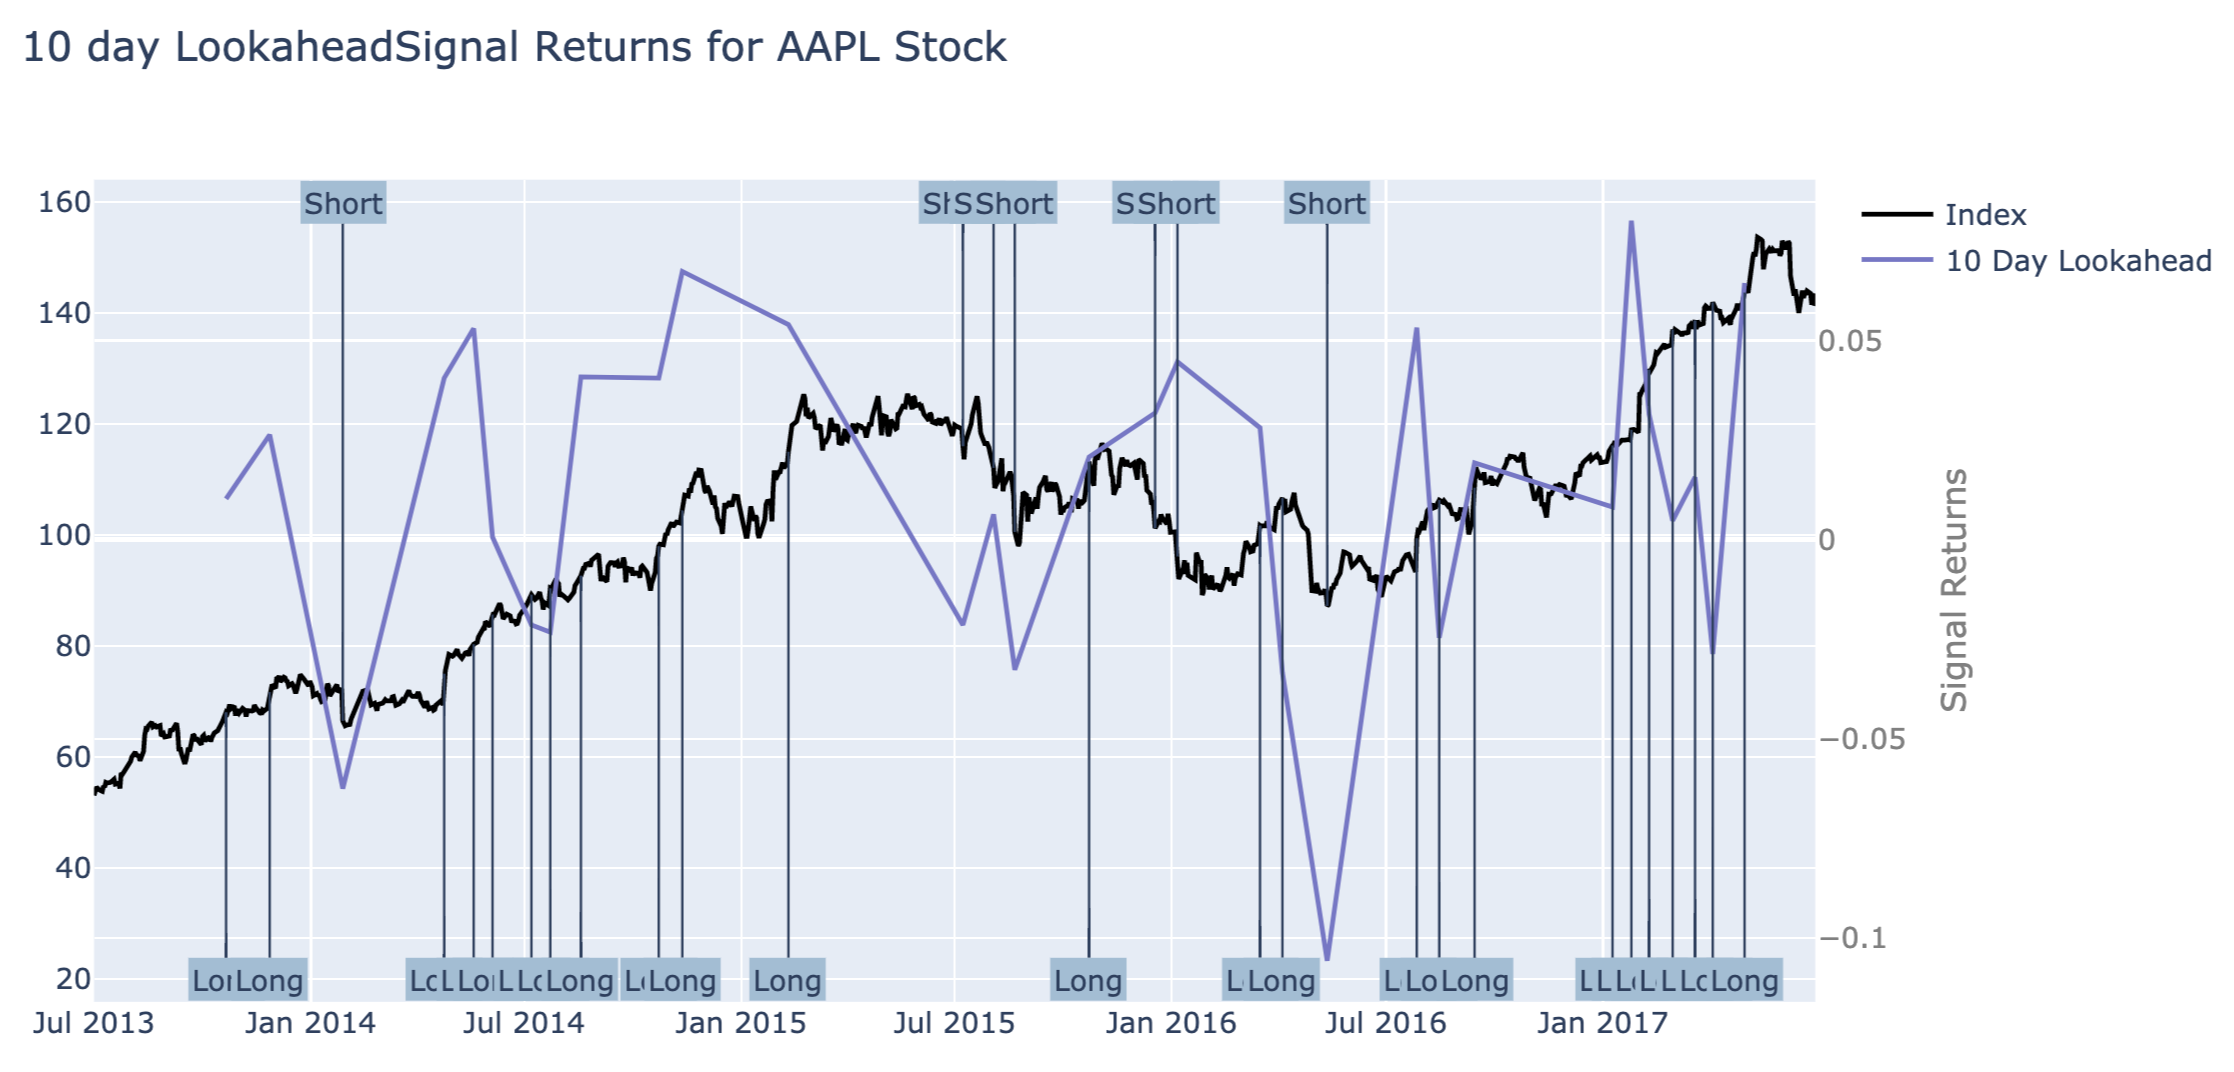
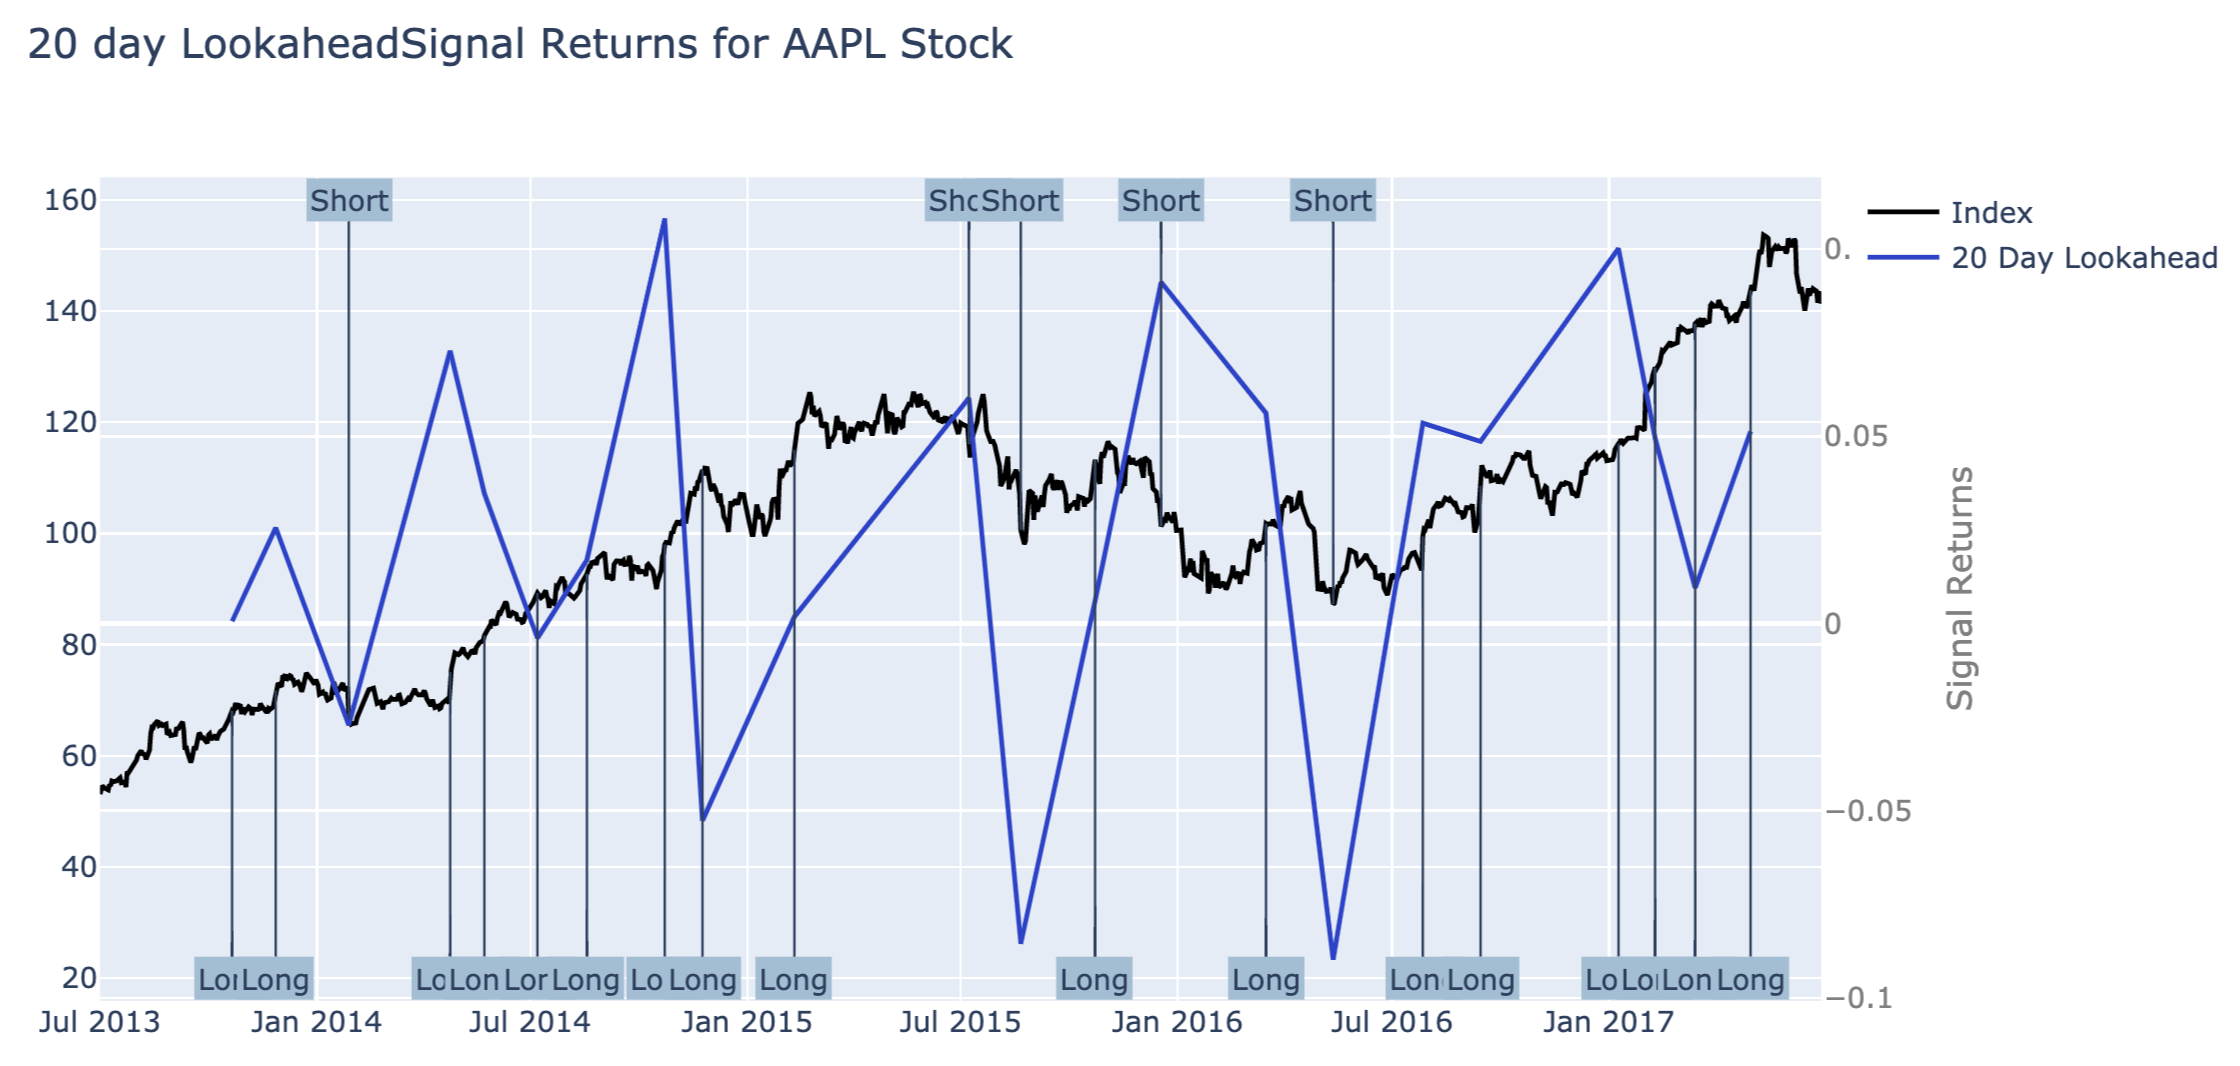
Implement the Breakout strategy to our stock universe, and then we got signal returns as follows.
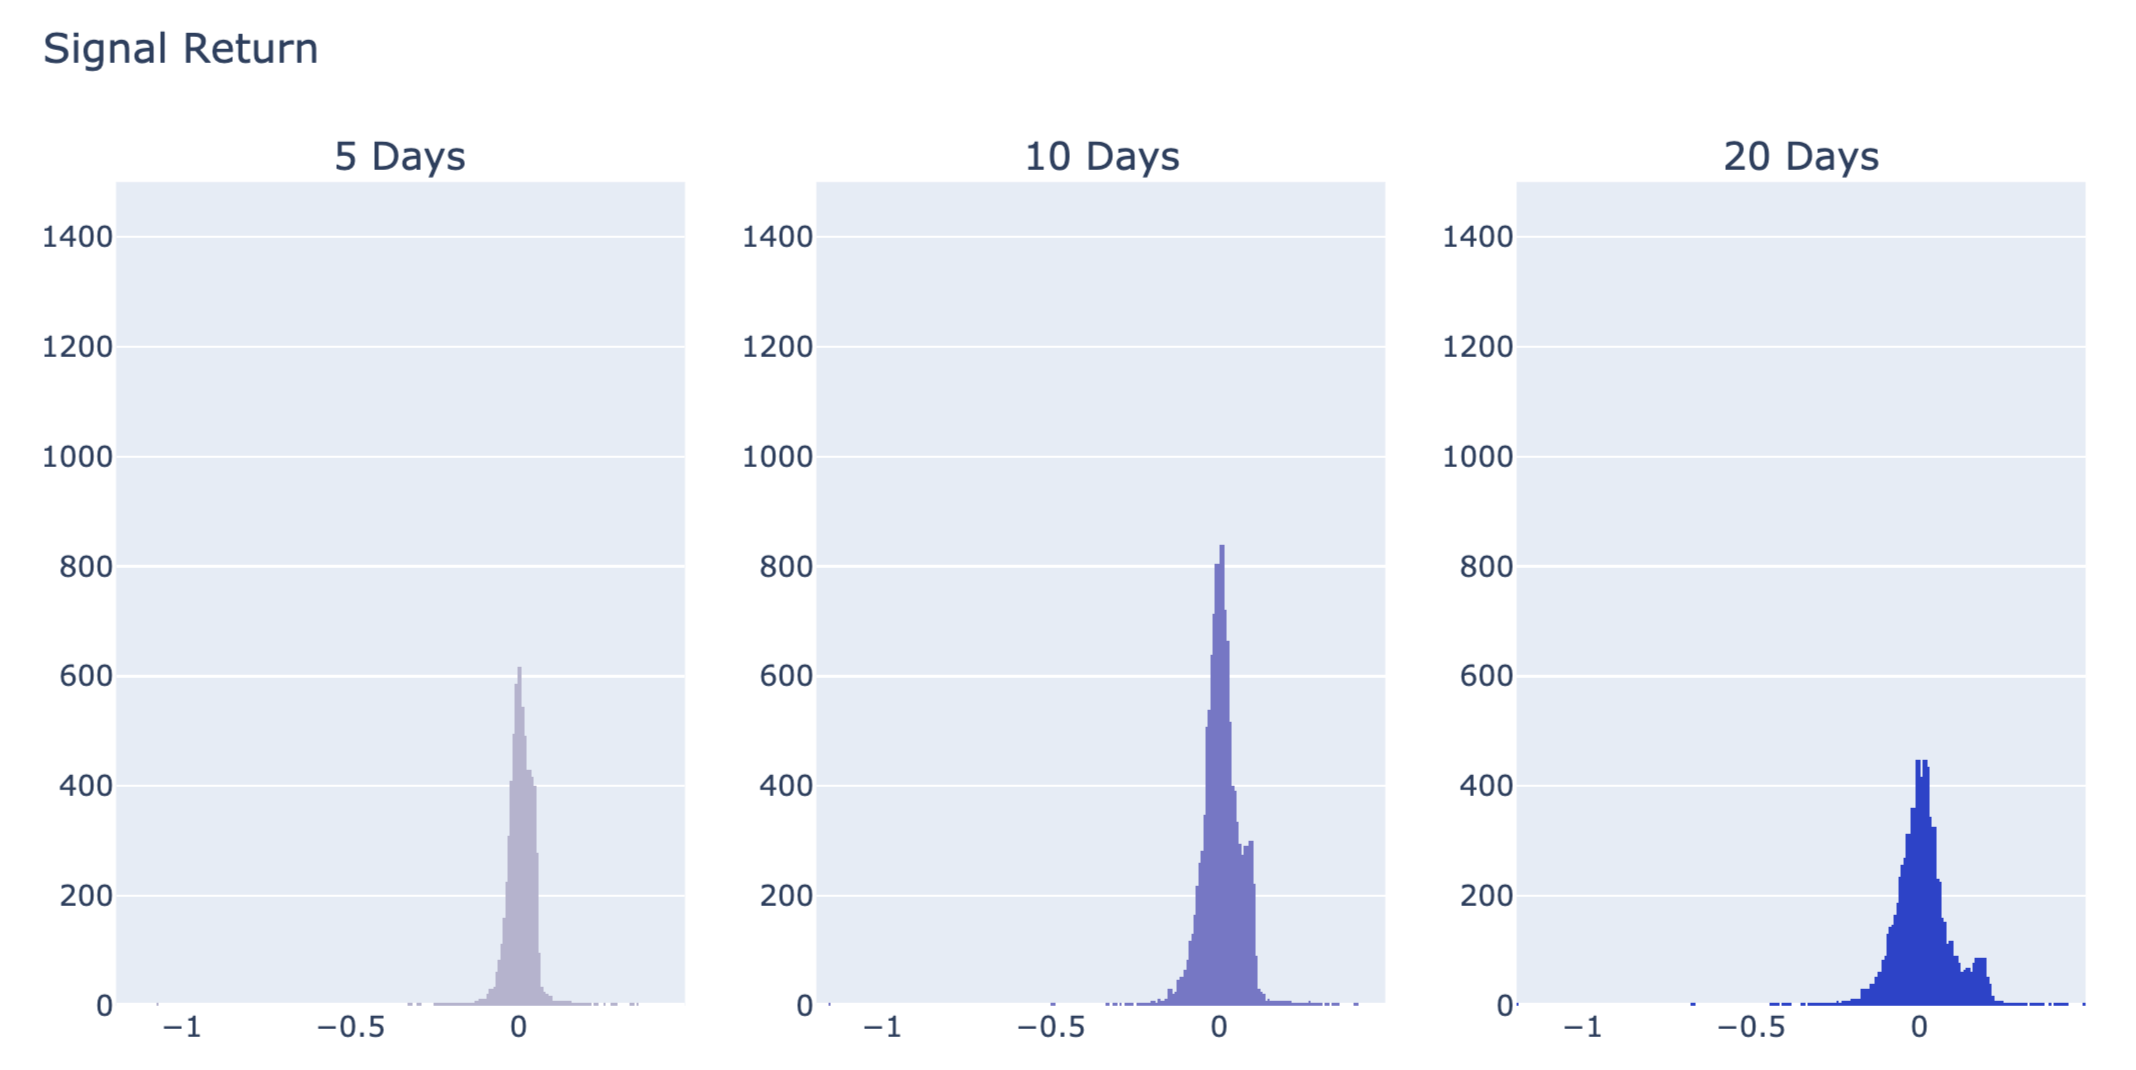
The histograms are not normally distributed. They are right skewed. This is because of some big positive return outliers. If the outliers are removed, the distribution would be more like normal distribution.
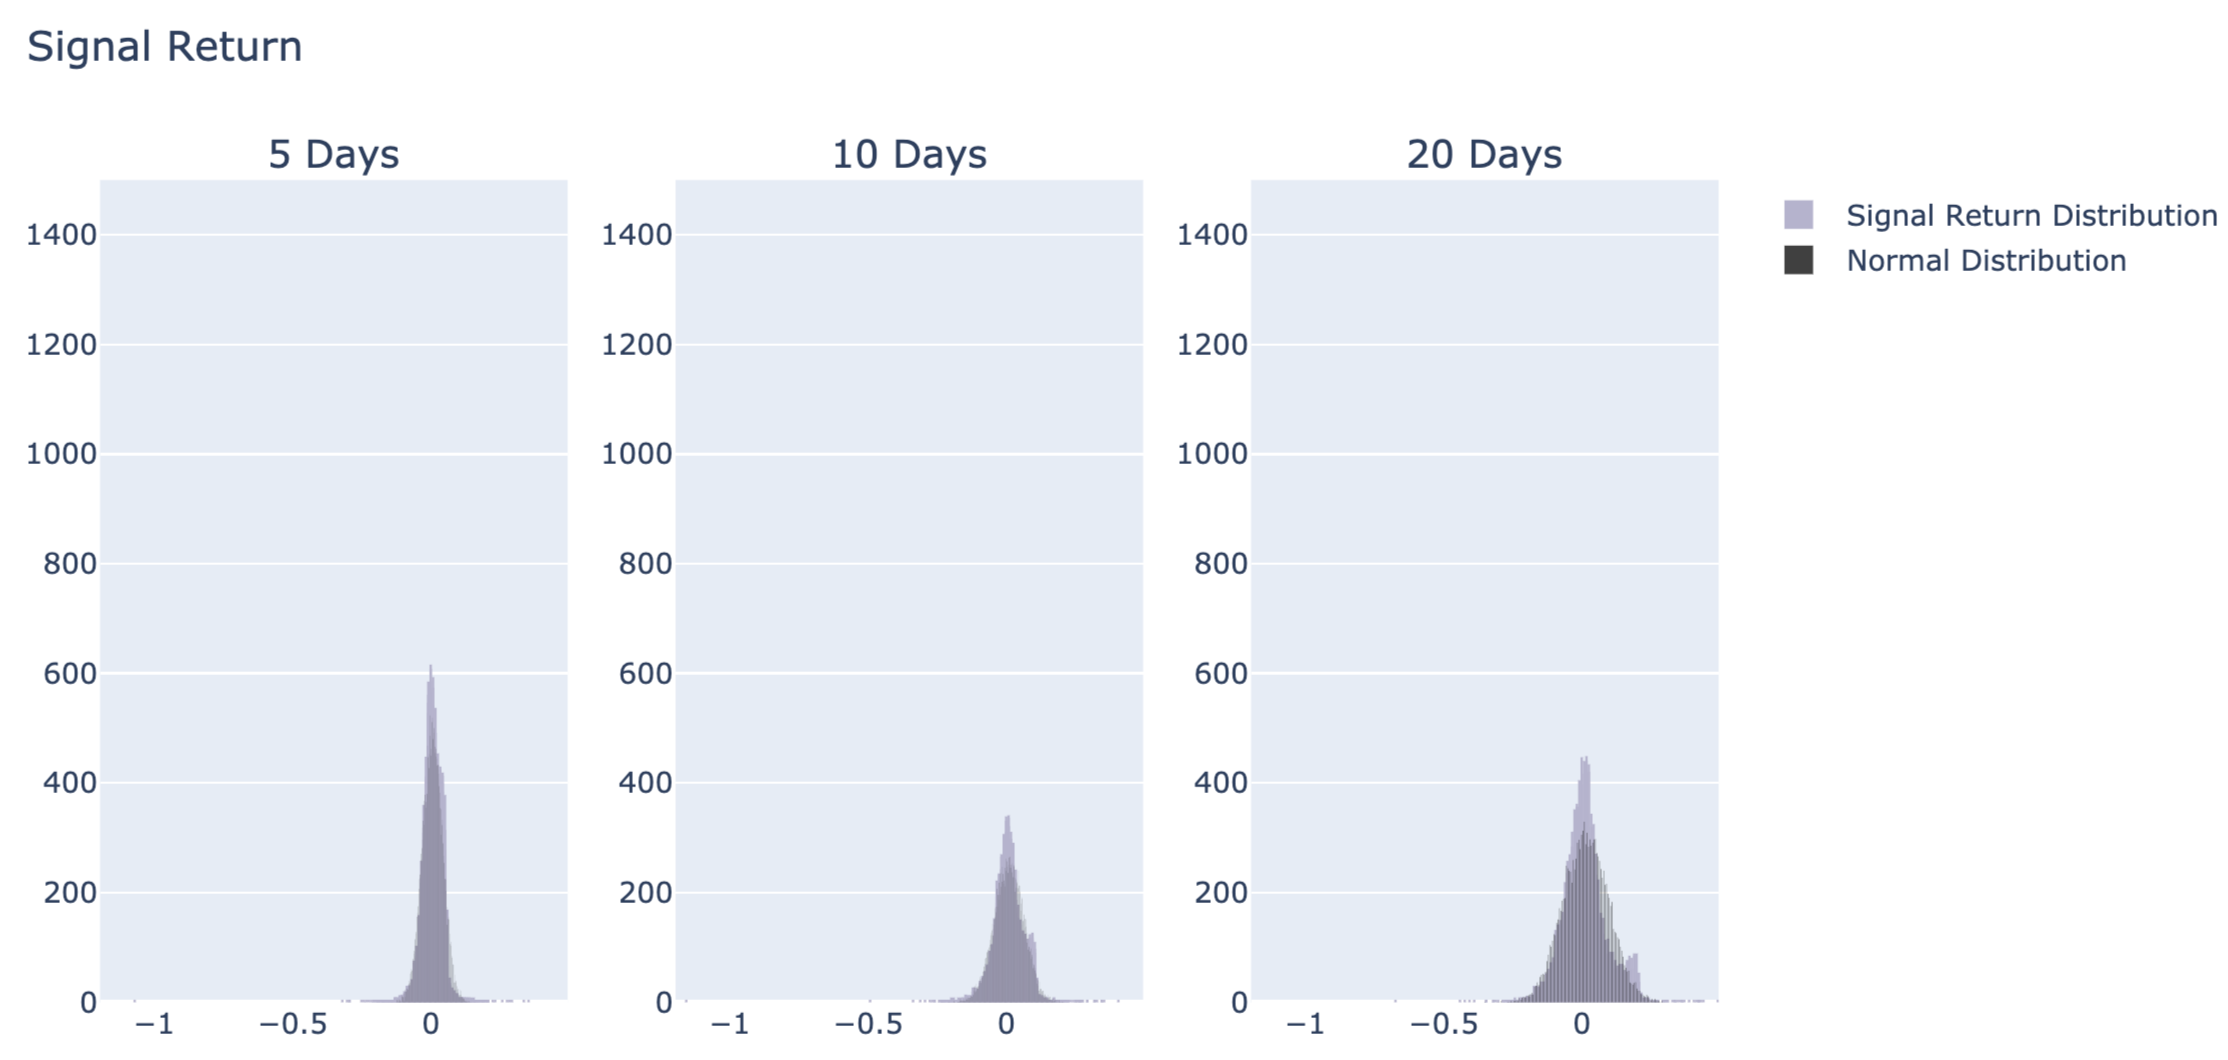
To better visualize the outliers, let’s compare the 5, 10, and 20 day signals returns to normal distributions with the same mean and deviation for each signal return distributions.
Kolmogorov-Smirnov Test
To find the stocks that are causing these outlying returns. We’ll use the Kolmogorov-Smirnov Test or KS-Test. This test will be applied to teach ticker’s signal returns where a long or short signal exits.
from scipy.stats import kstest


def calculate_kstest(long_short_signal_returns):
    """
    Calculate the KS-Test against the signal returns with a long or short signal.

    Parameters
    ----------
    long_short_signal_returns : DataFrame
        The signal returns which have a signal.
        This DataFrame contains two columns, "ticker" and "signal_return"

    Returns
    -------
    ks_values : Pandas Series
        KS static for all the tickers
    p_values : Pandas Series
        P value for all the tickers
    """

    ks_stats = pd.Series()
    p_stats = pd.Series()

    mean = np.mean(long_short_signal_returns['signal_return'])
    std = np.std(long_short_signal_returns['signal_return'], ddof =0)

    for ticker, group in long_short_signal_returns.groupby('ticker'):
        stock_return = group['signal_return'].values
        ks, p = kstest(stock_return, 'norm', args = (mean, std))
        ks_stats[ticker] = ks
        p_stats[ticker] = p
    return ks_stats, p_stats